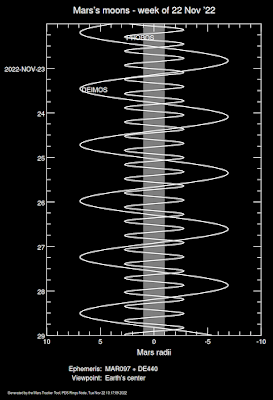
I did a Google search and found the tool. Then I edited the URL to land at the site. But, curiously, I didn't see the menu offering Mars. So, did another web search with Mars in the criteria. Found it!
Use the direct link for the Mars moons charting tool. It generates sinusoidal graphs which help determine the times of maximum elongation.
For the "Start time" and "Stop time" fields, I used the date format: Mmm d, yyyy hh:mm:ss" followed by "am" or "pm".
The parameters I used where:
- Interval: 15 minutes
- Ephemeris: MAR097 + DE440 (that's the default)
- Viewpoint: Earth's center
- Moon selection: both Phobos (M1) and Deimos (M2)
- Plot scale: 10 Mars radii
- Title: "Mars's moons - week of ..."
- Output to: Webpage & links
The 15 minute Interval smooths the lines.
The Viewpoint you might set to your observing location to get a topographical result.
The Output suggested gives you lots of options.
I did the colour inversion myself...
By the way, the magnitudes of the moons is 12.5 and 13.6. So you'll need a telescope aperture of 8-inch or bigger. Chris said "much bigger."
Happy hunting.


No comments:
Post a Comment