It was a pajamas day. I wanted to chill. Yesterday's hike was awesome but I just wanted to drink coffee and read and relax.
10:30 AM MDT. Read New York Times article on the eclipse, good, lyrical, fun. Evocative photos too.
Watched Tony's eclipse video. It was very nice. Captured the changing light and crowd reactions.
When Katrina talked about her temperature experiment and how it had changed by 7.4 degrees, we wondered what it would look like graphed. I said, "Let's do it!" Fired up John Repeat Dance and entered Katrina's data into Open Office Calc. We plotted the change. It was very interesting.
Via Bluetooth, I transfered the graph image to Katrina. She pushed it to Facebook.
I watched T's video again. I noticed the balloons go dark, one after another! That was very neat. The shadow moving over the landscape was not as striking as I expected it to be.
4:10 PM. Finished graph v2. I included my magnitude values. Chris helped me massage the data to emphasise the correlation. We could see the slight lag. Very cool (no pun intended).
We dined together. It was good.
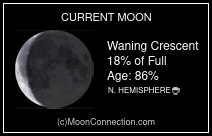
Around 8:00 PM, Ian spotted a crescent Moon. That Moon had very recently blocked the Sun.
We enjoyed a nice camp fire.
9:15. I looked up. It was clear again. Very clear. Saw Lyra and Cygnus in the clear spaces between the tall trees.


No comments:
Post a Comment