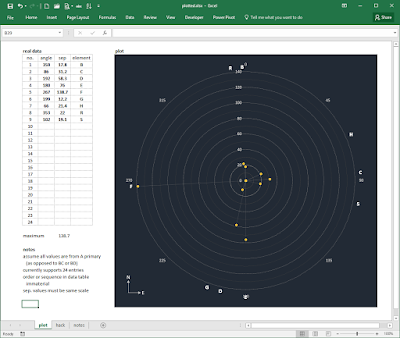
At long last, I built an Excel file to help with the plotting of double star elements. After reviewing a tutorial at the Ozgrid Business Applications website, I rolled out my radar chart. Really happy with the result.
I can rapidly plunk in a set of position angle and separation data (up to 24 entries, in any order) and the workbook produces an automatically scaled representation.
This will be very helpful when I'm trying to corroborate data values against something I've seen visually or photographed.
Wednesday, May 17, 2017
Subscribe to:
Post Comments (Atom)


No comments:
Post a Comment