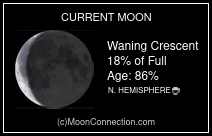
Monday, September 10, 2012
submitted usage graph
Sent the finished version of the internet usage chart to the CAO team for their review. I had added various annotations, particularly when something noteworthy was going on at the observatory, during spikes or lulls, a horizontal line showing the "daily" cap, small dark circles showing the new Moon dates.
Subscribe to:
Post Comments (Atom)


No comments:
Post a Comment