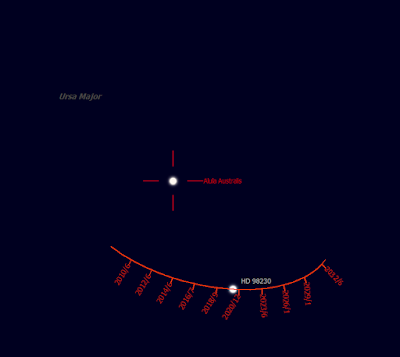
It hit me, as I logged my recent backyard observations, I have been watching ξ Ursae Majoris for a long time. "I should plot it," I thought.
My records were a little messy so I spent some time collating. Wow. Ten years! Then used some of the techniques I employed in my double star plotter workbook.
Here's a snapshot from my Excel file.
I was disappointed to find that my early records were poor. Or, to the point, incomplete. I was focused on the separation and not the position angle. That data doesn't appear, and it's casual at that, until 2016. Still, the last event, from a couple of nights ago, in a tiny telescope—surprisingly accurate.
Position angle (theta) and separation values (rho) are from SkyTools 3 Pro.
My graph corresponds nicely wiht the chart from ST3P.
Monday, May 04, 2020
Subscribe to:
Post Comments (Atom)


No comments:
Post a Comment